Forex & Stock Trading:
https://digitalstoredotdigital.wordpress.com/2021/06/24/stock-trading-strategies/
Good Things Come in 3’s ... before placing a trade.
* Keep an eye on the fundamental announcements calendar.
* Basket trading: Group your USD currency pairs - USDJPY, USDCHF, USDCAD - EURUSD, GBPUSD, AUDUSD, and NZDUSD into two baskets. As USD gets stronger - it pulls other currency in that pair downward.
1. Fibonacci Strategy.
2. EMA Strategy.
3. EMA Charting.
4. Breakout Trendline.
5. Economic Calendar.
6. Fish Hook Strategy.
7. Speedlines Strategy.
8. Finviz.
*only use short-term for information.
*only use long-term for background information.
9. W-trade.
10. VIX and SPX.
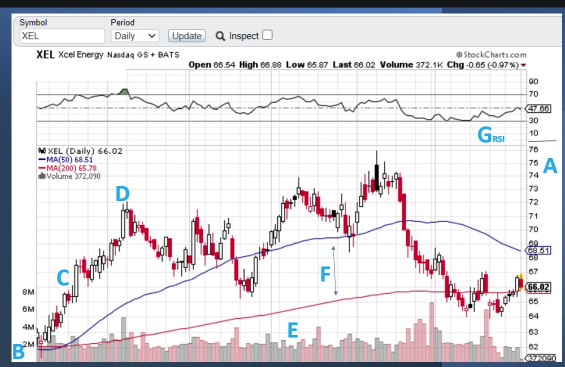
11. Bollinger Bands and Volume.
12. Wedge.
Profit.ly - Penny Stocks Alert.
13. Pay Trading.
14. Ultrasonic Calculation Entry Point.
15. Spread Trading: GBPUSD and EURUSD.
16. Correction.
17. Multi-Time Frame: 15 Minutes + 60 Minutes (1 hour).
- Market Direction -
18. Divergence.
19. Alligator indicator. (Hops and Lops)
20. Keltner Channels.
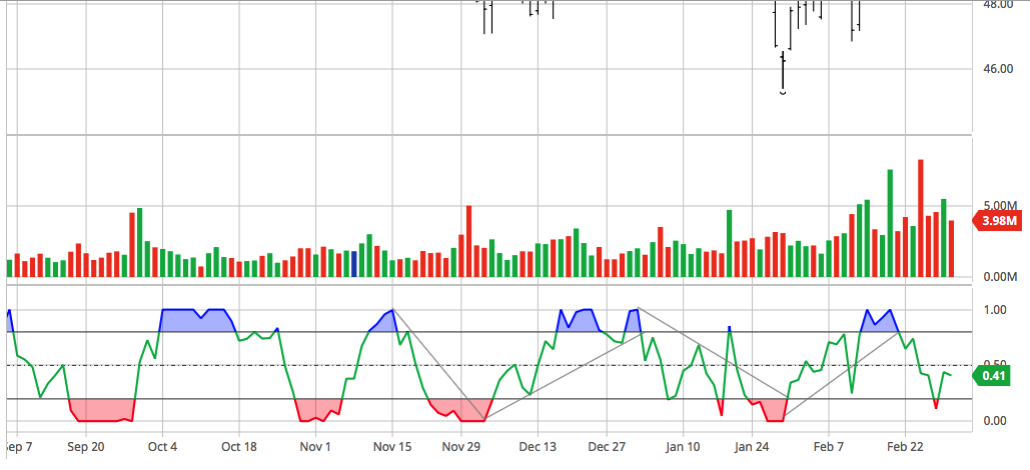
21. Stochastic RSI U-turn Strategy.
22. Sell-side trades makes fastest money.
* a Long Candlestick Bar is in-the-money.
23. ADX: Rise Above 20-level.
Reflects Strong Trend.
Fish Hook and ADX Strategy (Combined).
24. Bollinger Bands 50-EMA.
25. Elliott Wave.
Past Performance Indicators: Moving Averages.
Future Leading Indicators: Stochastics RSI (overbought/oversold zones).
26. Bull Market.
27. Bollinger Bands 50 EMA.
28. Fibonacci Extensions.
29. 90 Days Options Chain Strategy.
30. CCI Indicator.
(Commodity Channel Index)
31. Fish Hook and ADX Strategy (Combined).
ADX signal = Profit Payout
(click here)
Test your own strategy out. Rule of thumb is to test it out on a minimum of 10 trades.
33. Zig-Zag indicator.
Fiverr.
FUNDED TRADING ACCOUNT: TOPSTEPFX.
34. Elliott Wedge.
35. Speedline and Fish Hook Strategy.
36. Speedline and 20 EMA.
37. Parabolic SAR.
The Intelligent Investor
Benjamin Graham’s Mr. Market.
39. 3-3-3-3 Pattern.
Let's say GBPUSD.
GBP is Base Currency.
USD is Counter Currency.
Base currency is Always equal to 1 Unit.
So if GBPUSD is 1.2345
It means, £1 = $1.2345.
BID = The Price at which the Trader (You) Can Sell
ASK = The Price at which the Trader (You) Can Buy
For example, say the EUR/USD is trading at 1.2245 x 1.2248. In this case, the bid is 1.2245 and the ask is 1.2248.
The difference between the bid and ask constitutes the spread. In the above example, the spread is 3 pips, or points.
40. Bid and Ask Price.
(trade Under $40 Stocks)
42. Doji Candlesticks.
'Wisdom is the abstract of the past,
but beauty is the promise of the future.'
43. Invest in Penny Stocks : A Guide to Profitable Trading.
44. Range-bound Breakout.
45. Price Channel Breakout.
46. Short Sideways Consolidation. (20-40 Pips)
(Traders Merchant Marketplace)
'Believe it can be done. Believing a solution paves the way to a solution.'
47. win consistently in the "zero sum" game of trading
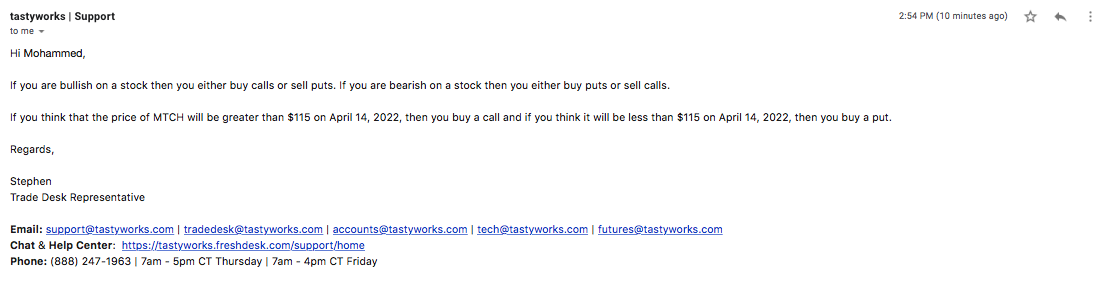
Options trading: I don't want to be interested if my stock price is at 5.54 or 5.84 - as long as its moving upwards to 9.4.
300% moves in a bullish/bearish engulfing position.
you want to start shorting that position.
hammers at the downside oversold position, ready to make a bull move.
(starting an uptrend)
hammer-man becomes a Resistance-level. (shooting star)
48. Hammer and Engulfing Candle.
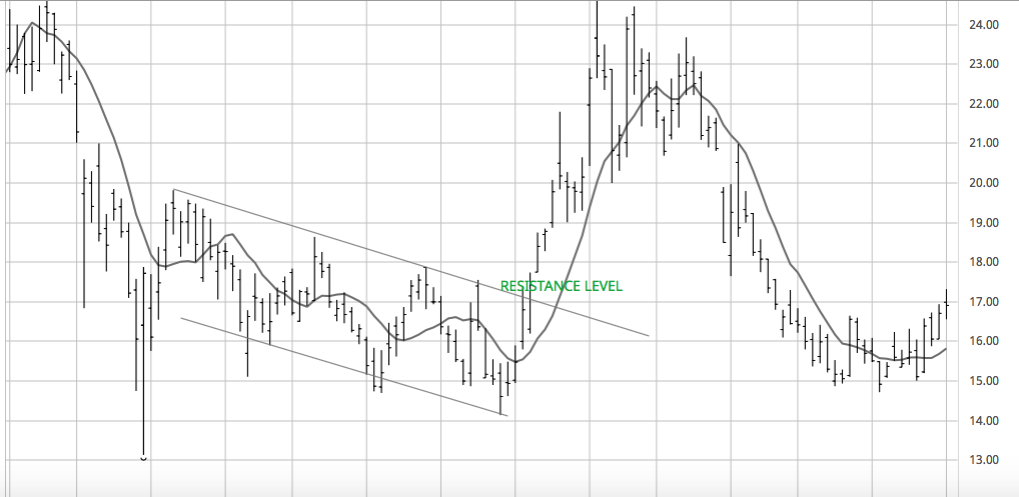
49. Resistance level.
50. Hourly Candlestick Charts.
51. Trading Opportunities - Fibonacci retracements.
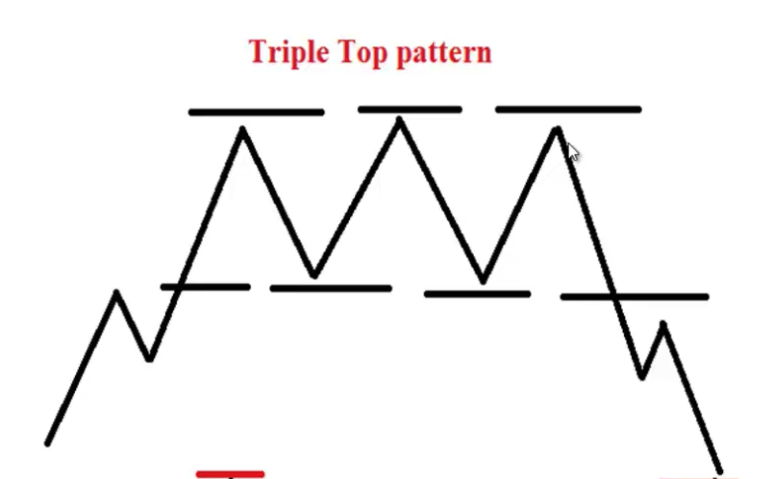
52. Bearish and Bullish Chart Patterns.
53. Long and Short 20 EMA Moving Averages.
54. Morning Star and Stochastic RSI.
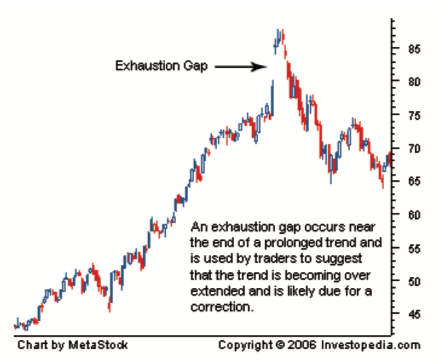
55. Kicker Signal Gap.
56. CCI Indicator Divergence.
- 100 Best Performing Stocks - (Buy trades)
- 100 Worst performing Stocks - (Sell Trades)
60. Pay Trading - Eric Shawn.
61. Flag Strategy.
62. Symmetrical Triangle.
63. Parabolic SAR - Resistance Levels.
64. 3x Fibonacci Retracement Levels. (turning points)
65. Abandoned Baby - Doji.
66. Doji 50 EMA Engulfing Candlestick.
67. Pan Method - Big Breakout / Big Candlestick.
68. J-Hook Pattern + Resistance.
Pre-Market Analysis: struggling in overnight trades.
Post-Market Analysis: break above or below next days trade.
after day markets - intraday trades.
great earnings - economic report.
As the saying goes: Be a Master-of-None - But a Master of Two.
69. Whipsaws - 1 minute and 5 minute Charts.
70. Parabolic SAR - Closing Points.
71. SAR Resistance Line.
72. Crossing the Parabolic SAR and CCI.
That's the game ... if you jump on greedy trades ... you'll have problems !!
Proportions Analysis.
73. J-Hook - Stochastic and T-line.
Rising ADX - Market is Strong.
74. Retracement 38.2 Fib. Level.
how to make 200 pips a day2000 pips a week
20 000 pips a year.
^^120 PIPS TARGET^^
^^30 PIPS RISK.^^
75. Fib. Extensions Target ABCD. (identify the Wave)
Options Trading Delta Formula:
let say for technology ETF share price is 63.00 for a PUT (Sell).
select 'OPTIONS PRICES.'
left menu column bar.
if midpoint between Ask and Bid price is 2.50.
and you buy 100 shares in a Contract.
if you'd make a $1 profit: you'd earn $250 x $1 = $250.
suppose the price went down further to $3 (Triple Digit Gains);
you'd earn yourself $250 x 3 = $750.
check for 'DELTA': if for a PUT delta is 0.59.
then you'd make 0.59 x $250 x $1 share = $147.50 at a $1 Breakout price.
76. Fibonacci Proportion Analysis.
**You can make money on a simple strategy - and form your own strategy by yourself.**
77. IF YOU DON'T KNOW ABOUT CANDLESTICKS - BUY A CANDLESTICK COURSE.
78. Doji Gap - 3% to 300% Profit.
technology news.
79. Price Pivots - Rolls over with Fibonacci levels 38.2/50/61.8.
80. Keltner Channel - Trend Indicator.
81. Confirm Price Action.
don't depend on Market Tips - back test your ideas thoroughly for hours.
ADVANCED REAL FOREX TRAINING.
***Investor Advisor, broker or dealer***
82. Rising Parabolic SAR.
83. you must backtest various market conditions.
Price has Memory.
2 Bar Break Setup - to the Upside - rally unto Speedlines.
focus on high probability trades.
4-10 Fish-hook.
84. Price Bars.
J-Hook after a very strong price move.
Trade stocks above $5 - get maximum leverage.
Find stocks in oversold conditions - had a big price move to the upside.
85. Signal Candlestick Strategy - a small candle 'inside' a big candle.
RSI works well in range-bound markets - but not breakouts.
RSI used to spot divergences.
RSI indicates overbought/oversold levels.
stop-loss at parabolic SAR.
86. Support Line.
87. Volume.
88. Volume Intervals.
**take trade in the direction of the prevalent dominant trend.**
science - not the art of trading - correct setup.
wait for the close of a bar - 15 minutes or 1 hourly charts.
MACD - both momentum and rangebound markets.
higher Volume indicates greater interest of people in a stock - on previous Friday.
Bollinger bands are an excellent range-bound indicator – meaning they work best when the market is not strongly trending, but rather fluctuating between a high barrier (resistance) and a lower barrier (support).
*Reversal Trader*
- if you can Win 3 times than you lose -
(best in the Upside - best in the Downside)
Volatility in the breakout.
A loss doesn’t mean you’ve failed. It means you’re on track. The game is having more, bigger wins than losses at the end of the day
Rule is: be kind to others ...
89. Volume Bars: Close at the 3rd Bar - Entry at the 4th Bar.
90. Markets always moves in a Zig-Zag pattern.
(an Uptrend - highs above lows)

- over 200 day optionable stocks -
RECIPES WORK! follow the recipe exactly.
people always want to add their own ingredients, that slow the cooking process.
with very little effort.
Ask and it is Given.
more fake breakouts (pullbacks) in a 5 minutes chart than a 15 minutes chart.
<favourite spot 20 period moving averages>
big money is often made in a trending market.
High oil prices has an effect on such industries such as Airlines, Chemical, Automotive, and Industrial Production. Price of oil has a very strong correlation to USD/CAD - where Canada is the main provider of Oil.
91. Trend Channel Point 1-2-3.
92. Elliott Wave Chart.
93. Elliott Wave.
94. W-Trade.
95. Charting Notes.
Surrender Prayer.Acceptance Prayer.
97. 5 Candlestick Strategy.
98. Attracting Abundance with EFT - Carol Look.
Gold: the price of gold tends to have a very strong correlation with such currencies as the CHF, and an opposite or reverse correlation to the USD.
Century Capital Group Course
99. 20 + 100 Moving Averages Support Points.
• Why selling SPY & SPX options offer incredible opportunities 3 times a week.
STOCK PICKS STOCK STRATEGIES
STOCK OPTIONS TRADING COURSES:
www.searchtempest.com
APIARY FUND - FUNDED FOREX ACCOUNT
**honour the higher time frame charts first**
https://investing.com/equities/52-week-high
momentum growth in last 3 months.
if you’re looking to enter on the one-hour chart, you want to begin your analysis on at least the 4-hour chart or any larger time frame’s chart.
The rule is to always have your secondary, larger time frame be at least four times the size of your initial time frame.
Stick to 2-3 Strategies Max
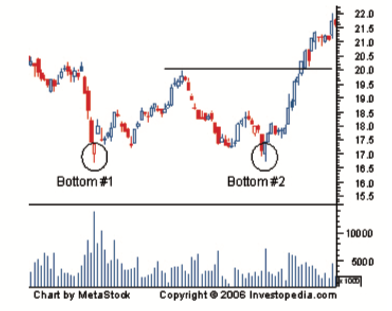
We can say that it is the bottom, a correction, a re-test, and a rebound. The pattern usually occurs at the end of trends and swings, and they are an indication of a change in trend. They can also be found within a trading range, and they take place when the directional momentum of a trend is diminishing.
- Point 1 is the lowest low point, forms a support level.
- Point 2 will be the peak, or the highest point, forms a resistance level.
- Point 3 will be the second low point, a support level (must be higher than point 1 which is the lowest low point.
- The price breakout above point 2 signals the continuation of the uptrend.
Source: NZD/JPY Chart, AM MT4, June 20, 15:15 Platform Time
- Point 1 becomes the highest peak when price finds resistance and moves down.
- Point 2 becomes the lowest low point, forms support.
- Point 3 forms when the price moves up and forms a resistance.
- The price breakout below point 2 support level indicates that the market is most likely to continue going south in a downtrend.
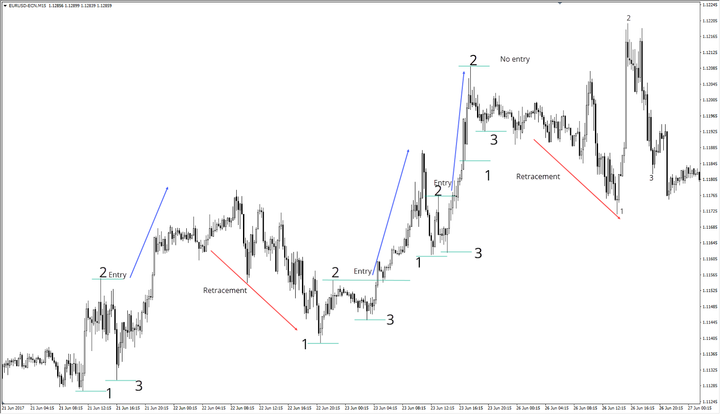
Source: EUR/USD M15 chart, AM MT4, 15:30 Platform Time
W-STRATEGY: PINBAR - USDCAD.
Remember, “if you’re not backtesting, you’re just guessing”.
100. head and shoulder strategy.
101. V-STRATEGY: NEWS RELEASE:
• HERE WE DETERMINE THE DIRECTION OF THE NEWS RELEASE BASED ON V FORMATION , AND INVERTED V FORMATION
IF THE MARKET FALL AND STARTS TO FORM A V BEFORE THE NEWS RELEASE, KNOW THAT THE MARKET WILL COMPLETE THE V WITH THE NEWS RELEASE MEANING THAT THEB NEWS WILL BE A BUY
IF THE MARKET RISES AND FORMS AN INVERTED V , KNOW THAT THE NEWS RELEASE WILL FALL AND COMPLETE THE INVERTED V PATTERN
EXAMPLES OF V BOTTOM:
THE MARKET CANNOT KEEP ON FALLING NOR RISING , SO WHAT GOES UP ALWAYS COME DOWN.
EVERYDAY IN THE MARKET , THERE IS A CONSOLODATION , FALSE AGGRESSIVE MOVE OUT SIDE THE CONSOLODATION THEN THE M OR W FORMATION AND REVERSAL (THIS IS CLEAR ONLY ON 15 MINUTES CHART )
WHEN THE MARKET RISES AND FORMS AN M ,SIGNALS SELL
WHEN THE MARET FALLS AND FORMS A W,SIGNALS BUY
THE HIGH OF THE DAY WILL ACT AS A RESISTANCE FOR THAT DAY
THE LOW OF THE DAY WILL ACT AS A SUPPORT FOR THAT DAY
THE SECOND LEG OF THE M THAT FORMS AND END AS A REJECTION SIGNALS SELL SO SELL IMMIDIETLY WHEN YOU SEE THE SECOND LEG ENDING WITH A HUMMER OR PIN BARS.
find someone who already knows the market,
has a history of spotting winning pairs and
ask him to show you his best trades.
***102. DIVERGENCE STRATEGY - BULLISH/BEARISH 'REVERSAL' SETUP.***
One effect of a rising VIX is a rising demand for gold.
when VIX is high, markets come crashing down.
when VIX is low, markets hit the roof.
RSI IS A MOMENTUM INDICATOR:
DIVERGENCES
OVERBOUGHT AND OVERSOLD REGIONS
POSITIVE AND NEGATIVE REVERSAL SETUPS.
much more zig-zag than stochastics oscillator
when reaches level of 70 and 30, prices change direction
find tops and bottoms better than stochastics
at level of 50 and 40 is consolidation
Uptrend - RSI Oscillates between 70 and 50.
Downtrend - RSI Oscillates between 30 and 50.
higher top - lower top - divergences.
TURN PRO TRADER
TURTLE EUR EA
very small drawdown.
10% monthly return = 200% profit.
so, with a £1000 account, you make £3000 a year.
3-4 trades per week.
monitor 10-12 markets of daily time frame.
6 losing trades a month - about 3XR per month.
maximum drawdowns.
some trades will be losses - can't avoid it.
FOREX DIVERGENCE INDICATOR
forex / stocks education
THE ART OF MORPHING:
taking a losing trade and turning it into a winning trade.
closing down the loser. shut that down.
institute a new trade.
one addition or subtraction of a component, in one move, one trade.
www.streetwisenews.com/zz/
Option Chain Greeks
Greek values - strikes
delta, theta, gamma, vega
Put Calls Skews
cancel each other out
left with Deltas
must add up to 100.
ALPHA CODE.
the ton trader.
Reiki Qigong.
(energetic cords)
103. Wedge and EMA line.
104. forex strategy Pinbar and Contracts.
(STOCK TRADING FORMULA)
Risk = $20. (Alligator)
<<trades that go with the trend>>
LONDON BREAKOUT STRATEGY
'make money when you're wrong !!'
105. Divergence - Pinbar (inside bar) - 10/20 EMA Line.
106. SPX - long-term trades.
Well, as the old trading aphorism says “Market take the stairs up and the elevator down” and it’s the way the market have been functioning for centuries.
107. ATR indicator breaks through 20-EMA line.
108. Strong Reversal Candle - Support and Resistance levels.
The European session has the most directional movement, and that is closely followed by the U.S. session, and then the Asian session.
Directional Movement Helps with Reversal Points:
109. 50-EMA-line Overbought/Oversold Zone.
If I lose two trades in a row, I will stop placing trades until the following day.
| https://www.easytees.co.uk/ | 151 26380151 |
| https://www.fanela.co.uk/ | 1530 517 777 |
| http://www.write-here.co.uk/ | 1473 250 970 |
| https://www.balconyshirts.co.uk/ | 1895 239111 |
| https://www.dragonsigns.co.uk/garment-printing/ | 1323 833683 |
| https://www.dallasdesignsltd.co.uk/index.php/4/ | 1343541414 |
| https://www.admiraltees.co.uk/ | 1502 511 132 |
| http://www.samuelsofnorfolk.co.uk/garment-printing-print-guide.html | 1603 710007
|
| http://www.jedaprint.co.uk/ | 706 214514 |
| http://inkandstitch.co.uk/ | 1603 952989 |
| http://www.totshirts.co.uk/blog/ | 20 8887 7900 |
| https://www.scotsigns.ltd.uk/garment-printing-embroidery/ | 1506 413563 |
| https://www.cardiffembroidery.co.uk/dtg-direct-to-garment-printing | 2920 224 880 |
| https://kustom-clothing.co.uk/ | 1462 456332 |
| http://www.quickstepsdoncaster.co.uk/ | 1302728877 |
| https://www.crunchbase.com/organization/garment-printing | |
| http://garmentprinting.co.uk.websiteoutlook.com/ | |
| https://tshirtprintingservices.co.uk/ | 207 101 9315 |
| https://3rdrailclothing.co.uk/ | 2072310866 |
| http://www.dtgtshirtprinting.co.uk/ | |
| https://www.garmentprinting.co.uk/clothing-printing/t-shirt-printing | |
| https://www.amayauk.com/ | 2392 590281 |
| https://www.a4apparel.co.uk/ | 1271 816158 |
| http://www.frizbee.co.uk/t-shirt-printing/ | 1303 720086 |
| https://www.clothesprinted.com/ | 333 577 3700 |
| http://t-shirtprint.com/companydetails.asp?UID=818 | |
| https://www.embroidered-printed-clothing.co.uk/ | 800 051 8444 |
| https://www.shirtworks.co.uk/ | |
| https://sarahsembroidery.co.uk/ | |
| https://www.printsome.com/ | |
| https://www.printsome.com/t-shirt-printing-liverpool/ | 203 598 2599 |
| https://www.buytshirtsonline.co.uk/t-shirt-printing-embroidery-i37 | |
| https://www.cardiffembroidery.co.uk/ | 2920 224 880 |
| http://www.october.co.uk/ | |
| https://www.iconprinting.com/ | |
| https://www.logobear.co.uk/ | 191 222 1138 |
| http://www.i-prints.co.uk/ | 796 858 1791 |
| http://www.fifthcolumn.co.uk/ | 20 8801 2383 |
| https://www.colourwaysprintandembroidery.co.uk/ | 1252 344 944 |
| http://www.castle-embroidery.co.uk/ | 1539 735656 |
| https://www.jtlembroidery.co.uk/ | |
| http://arenascreen.co.uk/ | 1392 364407 |
| http://www.westcoast-embroidery.co.uk/services/ | |
| http://www.carillionprint.co.uk/ | 1179 739 020 |
| http://www.wessexclothing.co.uk/ | 23 8022 4622 |
| http://jageto-embroidery.co.uk/ | 1376 550 563 |
| https://www.shirt-printers.co.uk/ | 01271816 |
| https://www.jwuk.com/index.php/dtg_printing/?k=:11:: | |
| https://empireprintingandembroidery.com/ | 1508 531004 |
| http://elizabethsembroidery.co.uk/ |
110. Stochastic RSI and Multi-time frame.
(previous highs)
best to buy shares on FTSE 250.
liquid shares. and prices dont fluctuate as much.
exit whenever you like.
trade on a Trading ISA Account.
You're wrong even if you're right !!
a confirmation bias is when you have only one process, that you say it works.but things can turn around against you.
you might not win all the time with that process.
but the Rule is: make lots of small losses ... but One or Two Big Wins.
and you can make alot of money !!
CONSOLIDATION/IMPULSE/CONSOLIDATION/IMPULSE ...
Place the Trade Then Turn it Off
111. 21 EMA and Keltner Channel.
112. Fibonacci Retracement Ratio.
TOTAL GAMBLER MAGAZINE
European Roulette.
Roulette Bets.
113. Inside Pinbar Strategy.
114. Fibonacci Retracement 38.2 Not a reliable trade ...
115. Fibonacci Extensions: termination of trend at 127.2% and 161.8%.
116. Bull Kicker 50 EMA.
117. Support and Resistance Levels with Breakout.
- PROREALTIME Charting -
118. W-TRADE: free and clear indicator.
BUY THE DIPS STOCK TRADING STRATEGY.
119. MACD Pinbar Strategy.
120. Support line and Fibonacci Retracement Ratio.
Nasdaq 100
122. P/E Ratio.
STOCK FINDER:
if you trade in a company share.
and its annual profit is lets say £10 million.
the market cap ought to be near 15 times the Profit.
so the company must be worth, in this case: £10 million X 15 = £150 million.
"Grid trading system"
momentum - 'acceleration of market.'
CONTINUATION/REVERSAL PATTERNS:
(Support/Resistance)
"disruptive companies stocks list"
123. Deep Dip Buy Strategy + 250 EMA line.
124. Trading View Charting.
125. Dip Buy 'Exit' Strategy - 30 RSI.
126. TradingView 20 EMA support-line.
20 List of 5G Small Cap Stocks.
127. Calculate how many shares with 2 ATR.
STOP LOSS SYSTEM:
trailing stop losses,
are when you have a digital numerical Price,
either goes up or down,
with stock price or currency pair,
the trailing stop follows it, to profit,
if my share price for AAPL was 110, lets say.
and you wanted to move trailing stop, in an upwards direction,
lets say, you set it at 20 pips or price.
so, if AAPL rises to 130 in Price,
your trailing stop will move up by 20.
TRAILING STOP ALLOWS YOU TO PROTECT YOUR POSITION SIZE.
DON'T TRY TO BE A GENIUS.
Buy or Sell at the perfect moment.
DON'T WAIT FOR IT TO BE DOWN 50%.
and never be down more than 20%.
5 Pages a day ... read half the book ... !!
128. Fibonacci Retracement highs and lows.
A-B-C Charting Formation combine with Options Strategy.
"STOCK REPLACEMENT STRATEGY"
The delta is a ratio comparing the change in the price of an asset to the corresponding change in the price of its derivative. For example, if a stock option has a delta value of 0.65, this means that if the underlying stock increases in price by $1 per share, the option on it will rise by $0.65 per share, all else being equal.
Therefore, the higher the delta, the more the option will move in lockstep with the underlying stock. Clearly, a delta of 1.00, which is not likely, would create the perfect stock replacement.
An option with a delta of 1.00 priced at $10 would move higher by $1 if its underlying stock, trading at $100, moves higher by $1. The stock made a 1% move but the option made a 10% move.
Stock Replacement Strategy:
Let's say a trader buys 100 shares of XYZ at $50 per share or $5,000. If the stock moved up to $55 per share, the total value of the investment rises by $500 to $5,500. That's a 10% gain.
If the delta of the option is .80, when the underlying stock moves up by $5, the option moves up by $4 to bring the value of the contract to $1,600.
Round Numbers: TP 20 Pips - SL 10 Pips.
End of bitcoin.
Which months are the best for forex trading?
This makes autumn months the best time of the year to trade Forex. By the second half of December, trading activity slows down - much like in August. The few weeks before and after Christmas are the slowest. It's not until mid-January that the markets start to pick up.
129. TradingView Stochastic RSI - stock trading.
130. ATR - Average True Range - number of shares.
is Bidden about to ban Bitcoin:
American government bring in the 'digital dollar' to replace Bitcoin. Expected to turn every $1000 into $67 000.
Besides Bitcoin threatens dominance of the dollar. No taxes are put on it. Bitcoin threatens American money. Money must only be government controlled, no other, to devalue the dollar. It risks losing control if Americans switch to non-government money.
European banks say Bitcoin needs to be regulated.
SELECT A STORE TO TRADE:
look at the word 'transformational.'
select a stock your friends know about at the store.
it could be MotherCare ... your partner might have a bad opinion about it.
that on the Charts its a slump !!
Ask again your friend their favourite store ... could be a Next Store ... where they're happy shoppers.
Next could be doing very good on the charts as a bull trade.
HAPPINESS INDEPENDANCE:
the American Declaration of Independance guaranteed the right to the pursuit of happiness.
if something makes us feel dissatisfied, then it is a violation of basic human rights.
GDP was one way nations evaluated national success.
take Singapore, each citizen produces an average of £45 000 worth of goods and services.
it is a more successful country than say Costa rica, a citizen produces £11 000 a year.
but today GDP is being supplemented with GDH (gross domestic happiness).
no one wants to produce, they want to be happy.
costa rica report the highest level of satisfaction than Singaporeans.
something worth thinking about.
131. CONSOLIDATION A-B-C PATTERN.
132. Rejection of 50 SMA line.
133. Ascended Triangle Strategy.
134. Options Trading Strategy - Market Cap.
FTSE 250 stocks are your best bet.
trading range patterns.
ideal for short-term trading.
look out for boring companies.
these are the ones that make you the big money.
long-term rising chart.
ELLIOTT WAVE STRUCTURE.
135. 5 EMA line RSI 70.
136. 5 EMA line - Keltner Channel.
STOCK TRADING COURSE.
If you are entering a trade that you expect to last several days, it is best to trade in the direction of the overall market.
137. 1.5 ATR EXIT STRATEGY & STOP LOSS.
when AIM shares is planning to move into the 'main market',
it suggests a Buy signal.
FTSE 250 london stock exchange. worth £600 million each company.
AIM shares are very small companies though.
STEVE JOBS:
Zen saying: if you are willing to travel around the world to meet a teacher,
one will appear next door.
steve jobs once visited india:
he says the indian villagers follow 'intuition,'
and don't use their intellect.
that intuition is a very powerful thing,
and had an impact on steve jobs work.
NICOLAS DARVAS BOOKS.
138. 1 Candlestick Strategy - using a long Wick.
139. Levels Strategy - engulfing candles.
140. Key-Levels Strategy.
141. Keyword Research: how to do a 'Search Query.'
"if I make no decisions myself,
this day will be given to me."
(a course in miracles)
142. Finviz charts selection.
Reiki beam:
send reiki beam to someone or yourself,
sending out blessings with your palms of hand.
send it to God, jesus, mohammed.
using a photo.
send reiki beam to a crises situation,
to someone on TV or a newspaper.
reiki can have no harm on someone.
so send blessings to them.
143. Darvas Box.
144. Darvas Box Strategy.
145. Darvas Box 4 Candlesticks Breakout.
146. Elliott Wave and Keltner Channel Strategy.
147. Triangle Formation - abcde.
148. Exit @ 10 EMA.
149. Head and Shoulders - Peak - Price Explosion..
150. Head and Shoulders.
A strangle is a popular options strategy that involves holding both a call and a put on the same underlying asset.
$5 Outside-the-money.
so if we have 320 as a strike price: we'd get a Call for 325 and a Put as 315.
BUTTERFLY:
Butterfly: 1 by 2 by 1.
All $1-wide.
$2 difference each-strike-equadistant.
Long-call-vertical.
Best place to go: 309 (307-309-311).
Sell - hit on the bid.
Call - hit on the ask.
It’s okay if you’re not a pro !
151. PRICE ACTION CHEAT SHEET.
152. J-Hook Strategy.
I love Volatility !!
153. Channel Strategy.
154. Finviz Dream Trades.
'CONSOLIDATING PRICE ... KNOW A BREAKOUT IS COMING.'
155. Island Reversal Strategy.
156. Trading within the Range.
157. Parabolic-SAR-resistance line.
158. Index Sniper - New York opening hours - 10 OHLC Bars count - AMZN - 5 minutes timeframe - 50 minutes trade.
159. Market trendline.
160. Amplitude.
161. 7-Candlesticks Buy Entry.
***smaller the time-smaller the risk-smaller the reward**
The 7/11 Rule
162. Flag-Strategy:
***how market retraces short***
***how market extends aggressively***
163. CONSOLIDATION PATTERN:
164. U-turns = 'entry opportunities' (drawing a trendline backwards)
We’re gonna find previous lows to find u-turns.
I’m all for testing.
As long as market is above blue line - buy zone.
As long as market is below blue line - sell zone.
165. BUY ZONE - SELL ZONE.
look at how the market rallies down, along the neckline (fake-breakout).
**how Steep the Chart is**
DO NOT trust sideways movements with u-turns.
166. Counter-Trendline.
167. Market Direction.
The market wants to be beautiful, symmetrical.
Market has created a new resistance level, the market wants to be pretty.
Find where the market u-turns.
You got this angle causing the market to go up.
Do you wanna buy with the crowd. Or be the first one.
Trendline - market direction - draw a straight line.
168. 2-Candlestick Strategy.
169. Trading strategy guides Strategy:
170. Fibonacci Extensions - barchart.com.
171. fibonacci - Start it from the lowest point of the trend.
2 candles to the left - 2 candles to the right.
7 candlesticks up - a red candle.
172. Red Candlestick - u-turn.
173. 1-2 Up Fibonacci - Smart Fib.
Insider Scanner.
Stocks List - Nasdaq 100 Index.
QQQ Mondays - 5 day week period.
Thursday “SPY Day”. Each Thursday.
Daily Low-Risk Stock Picks
The gap 5%.
We want those gaps, bigger earnings potential.
Hit target within 120 hours 5 days, swing traders.
We want S&P 500 Stocks, bread and butter.
UNDER $40 STOCKS.
NAKED CALL - BEARISH
COVERED CALL - BULLISH.
Elon Musk: Insider Trading Cluster Buying.
174. Channel Charting.
Biotech industry: stocks screener.
Those are the companies I’d like to look at.
Place a parallel channel line.
We knew we had support here, a resistance here: a descending channel.
A full channel extension.
Strong area of support.
Thats my thought process on that.
Small cap fortunes.
Trade Long or Short: Markets drop x3 times faster, than rising up.
Market Orders: low volatility to Limit Orders.
"message board": watchlist: NASDAQ.
ARBITRAGE $167.
$77.
175. 200 day Moving Averages.
176. 50/200 Moving Average Crossover to the Upside.
177. Bollinger - Counter Trendline break.
178. 5-Factor Multi-time-frame.
179. 5-Factor Multi-time-frame Sell Position.
180. Trendline Plotting.
181. 30-Days Touchpoint.
182. Trendspotter indicator.
183. 10-Day Moving Average.184. FINCLUB.AI: ENTRY/EXIT POINT.
Options chain:
Which is better volume or open interest?
The greater the volume, the more interest there is in the security.
How do you select the strike price on a chain?
Key Takeaways:
A conservative investor should opt for a call option whose strike price is at or below the stock price.
What if volume is higher than open interest?
When the volume exceeds the existing open interest on a given day, it suggests that trading in that option was exceptionally high that day. ... When options have a significant open interest, it means there are a large number of buyers and sellers out there.
185. 90-Day Moving Average - Gap - Buy Momentum.
187. Symmetrical Trendlines.
188. Symmetrical Triangle.
189. RSI: Range Band.
190. Double Top: RSI.
191. Breakout - Resistance Level.
192. Cup and Handle Pattern - Penny Stocks.
193. Penny Stocks Chart - Rectangle and 200 EMA.
194. Volatility Play.
(uncovered a difference 300%-500%)
Best time to Sell stocks is just before reaching Resistance Levels.
Reversal transition into Consolidation Market - into a Trending Market.
195. Confluence.
196. Retracement - Breakout.
197. Market trending below 50 EMA Bollinger Band.
198. SIPHON X Strategy.
199. Bollinger Band 50 Method.
200. Forex 50 Pips Method.
202. Gap Exit Strategy.
(SUPPORT/RESISTANCE LEVELS)
203. Low Volume Consolidation.
204. Directional Trades - Trendline Channels.
205. Buy Entry Points using a Channel.
206. Aroon Indicator.
207. Delta Value. Market Chameleon.
208. Ichimoko Area.
"BIOTECH STOCKS" TEND TO WORK ALONGSIDE AN UPWARDS "CHANNEL".
TRIPLE MOMENTUM "IN PLAY"; STOCKS TRADING ABOVE ITS 50-DAY MOVING AVERAGE- ABOVE ITS 100 DAY AND 200 DAY.
208. PRICE LEVELS.
(Price will 'Stop' at the S+R Level: Bounce or Break)
The chartered market technician (CMT®) designation is a professional credential. It is earned by those who can demonstrate extensive knowledge and aptitude in technical analysis and trading.